2004 Demographics - Age, Housing Units, Race and Ethnicity, Marital Status, Educational Attainment, Household Income, Vehicles Available, Business Employment
2009 Demographics - Age, Housing Units, Race and Ethnicity, Marital Status, Educational Attainment, Household Income, Vehicles Available
2000 Census Demographics - Age, Housing Units, Race and Ethnicity, Marital Status, Educational Attainment, Household Income, Vehicles Available, Occupations
1990 Demographics - Age, Housing Units, Race and Ethnicity, Educational Attainment, Household Income, Vehicles Available
Trends - Population Trend, Household Trend, Average Household Size Trend, Median Age Trend, Housing Units Trend, Race and Ethnicity Trend
2000 US Census Employment Comparison Report - Occupation & Employment, Employment by Industry, Means of Transportation to Work, Occupation, Travel Time to Work
|
|
2004 Demographics
|
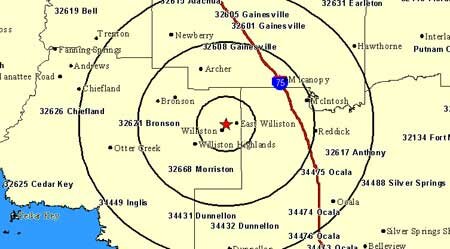
5 Miles: |
15 Miles: |
25 Miles: |
| Total Population |
6,746 |
46,040 |
349,551 |
| Total Households |
2,629 |
18,350 |
144,439 |
| Female Population |
3,564 |
23,672 |
179,468 |
| % Female |
52.8% |
51.4% |
51.3% |
| Male Population |
3,181 |
22,368 |
170,083 |
| % Male |
47.2% |
48.6% |
48.7% |
| Population Density (per Sq. Mi.) |
85.9 |
65.1 |
178.0 |
|
|
Age
|
5 Miles |
15 Miles |
25 Miles |
| Age 0 - 4 |
6.3% |
5.9% |
5.6% |
| Age 5 - 14 |
13.5% |
13.2% |
11.2% |
| Age 15 - 19 |
7.6% |
6.8% |
7.0% |
| Age 20 - 24 |
7.1% |
5.3% |
11.0% |
| Age 25 - 34 |
10.4% |
12.0% |
15.9% |
| Age 35 - 44 |
13.4% |
14.4% |
12.4% |
| Age 45 - 54 |
13.1% |
15.9% |
12.4% |
| Age 55 - 64 |
10.9% |
11.9% |
9.5% |
| Age 65 - 74 |
8.4% |
7.9% |
7.4% |
| Age 75 - 84 |
6.3% |
5.0% |
5.6% |
| Age 85 + |
2.8% |
1.8% |
2.1% |
| Median Age |
39.1 |
40.1 |
34.4 |
|
|
Housing Units
|
5 Miles |
15 Miles |
25 Miles |
| Total Housing Units |
2,919 |
20,475 |
159,474 |
| Owner Occupied Housing Units |
71.1% |
75.9% |
57.4% |
| Renter Occupied Housing Units |
19.0% |
13.7% |
33.1% |
| Vacant Housing Units |
9.9% |
10.4% |
9.4% |
|
|
Race and Ethnicity
|
5 Miles |
15 Miles |
25 Miles |
| American Indian, Eskimo, Aleut |
0.4% |
0.4% |
0.3% |
| Asian or Pacific Islander |
0.5% |
0.7% |
2.5% |
| Black |
28.2% |
16.6% |
18.4% |
| Hawaiian/Pacific Islander |
0.0% |
0.0% |
0.0% |
| White |
68.5% |
79.7% |
75.5% |
| Other |
1.0% |
1.2% |
1.5% |
| Multi-Race |
1.4% |
1.4% |
1.8% |
| Hispanic Ethnicity |
4.8% |
5.7% |
6.0% |
| Not of Hispanic Ethnicity |
95.2% |
94.3% |
94.0% |
|
|
Marital Status
|
5 Miles |
15 Miles |
25 Miles |
| Age 15 + Population |
5,410 |
37,066 |
291,315 |
| Divorced |
9.4% |
6.9% |
6.2% |
| Never Married |
24.8% |
22.2% |
34.0% |
| Now Married |
47.8% |
55.1% |
43.4% |
| Separated |
6.9% |
4.2% |
5.8% |
| Widowed |
11.2% |
11.6% |
10.7% |
|
|
Educational Attainment
|
5 Miles |
15 Miles |
25 Miles |
| Total Population Age 25+ |
4,415 |
31,690 |
227,893 |
| Grade K - 8 |
8.1% |
5.8% |
4.7% |
| Grade 9 - 12 |
17.1% |
14.5% |
11.6% |
| High School Graduate |
38.9% |
33.2% |
26.7% |
| Associates Degree |
5.3% |
6.8% |
8.0% |
| Bachelor's Degree |
8.6% |
10.6% |
15.2% |
| Graduate Degree |
4.6% |
9.5% |
13.5% |
| Some College, No Degree |
17.4% |
19.7% |
20.4% |
|
|
Household Income
|
5 Miles |
15 Miles |
25 Miles |
| Income $ 0 - $9,999 |
16.9% |
12.1% |
15.8% |
| Income $ 10,000 - $14,999 |
9.0% |
6.3% |
7.9% |
| Income $ 15,000 - $24,999 |
15.1% |
15.8% |
15.3% |
| Income $ 25,000 - $34,999 |
16.9% |
14.7% |
14.1% |
| Income $ 35,000 - $49,999 |
14.6% |
15.6% |
15.1% |
| Income $ 50,000 - $74,999 |
14.3% |
16.5% |
15.6% |
| Income $ 75,000 - $99,999 |
6.2% |
8.2% |
7.5% |
| Income $100,000 - $124,999 |
3.7% |
4.6% |
3.9% |
| Income $125,000 - $149,999 |
1.3% |
2.2% |
1.9% |
| Income $150,000 + |
2.0% |
4.1% |
3.1% |
| Average Household Income |
$43,122 |
$51,902 |
$46,370 |
| Median Household Income |
$30,085 |
$35,967 |
$32,714 |
| Per Capita Income |
$16,805 |
$20,687 |
$19,161 |
|
|
Vehicles Available
|
5 Miles |
15 Miles |
25 Miles |
| 0 Vehicles Available |
6.4% |
4.4% |
6.8% |
| 1 Vehicle Available |
39.1% |
35.6% |
43.1% |
| 2+ Vehicles Available |
54.5% |
59.9% |
50.1% |
| Average Vehicles Per Household |
1.70 |
1.80 |
1.70 |
| Total Vehicles Available |
4,490 |
32,897 |
240,351 |
|
|
Business and Employment
|
5 Miles |
15 Miles |
25 Miles |
| Number of Employees |
1,918 |
9,701 |
170,604 |
| Number of Establishments |
304 |
1,241 |
15,924 |
|
|
2009 Demographics
|
5 Miles |
15 Miles |
25 Miles |
| Total Population |
7,102 |
50,556 |
372,055 |
| Total Households |
2,827 |
20,622 |
157,753 |
| Female Population |
3,760 |
26,009 |
191,188 |
| % Female |
52.9% |
51.5% |
51.4% |
| Male Population |
3,342 |
24,547 |
180,866 |
| % Male |
47.1% |
48.6% |
48.6% |
|
|
Age
|
5 Miles |
15 Miles |
25 Miles |
| Age 0 - 4 |
5.7% |
5.8% |
5.7% |
| Age 5 - 14 |
12.4% |
12.3% |
10.8% |
| Age 15 - 19 |
7.5% |
6.4% |
6.2% |
| Age 20 - 24 |
8.1% |
5.6% |
7.9% |
| Age 25 - 34 |
11.1% |
13.3% |
18.6% |
| Age 35 - 44 |
12.1% |
13.5% |
12.4% |
| Age 45 - 54 |
13.2% |
15.7% |
12.5% |
| Age 55 - 64 |
10.8% |
12.3% |
10.4% |
| Age 65 - 74 |
9.2% |
8.1% |
7.5% |
| Age 75 - 84 |
6.7% |
5.2% |
5.7% |
| Age 85 + |
3.1% |
2.0% |
2.3% |
| Median Age |
39.6 |
40.1 |
35.7 |
|
|
Housing Units
|
5 Miles |
15 Miles |
25 Miles |
| Total Housing Units |
3,142 |
23,039 |
174,463 |
| Owner Occupied Housing Units |
72.2% |
76.6% |
58.8% |
| Renter Occupied Housing Units |
17.8% |
12.9% |
31.6% |
| Vacant Housing Units |
10.0% |
10.5% |
9.6% |
|
|
Race and Ethnicity
|
5 Miles |
15 Miles |
25 Miles |
| American Indian, Eskimo, Aleut |
0.4% |
0.4% |
0.3% |
| Asian |
0.5% |
0.7% |
2.5% |
| Black |
28.3% |
16.8% |
18.4% |
| Hawaiian/Pacific Islander |
0.0% |
0.0% |
0.0% |
| White |
68.5% |
79.4% |
75.5% |
| Other |
1.0% |
1.2% |
1.5% |
| Multi-Race |
1.3% |
1.4% |
1.8% |
| Hispanic Ethnicity |
5.4% |
6.4% |
6.3% |
| Not of Hispanic Ethnicity |
94.6% |
93.6% |
93.7% |
|
|
Marital Status
|
5 Miles |
15 Miles |
25 Miles |
| Age 15 + Population |
5,818 |
41,294 |
311,131 |
| Divorced |
8.9% |
6.6% |
6.0% |
| Never Married |
24.8% |
23.5% |
33.4% |
| Now Married |
46.3% |
52.3% |
42.3% |
| Separated |
8.2% |
5.3% |
7.0% |
| Widowed |
11.8% |
12.2% |
11.4% |
|
|
Educational Attainment
|
5 Miles |
15 Miles |
25 Miles |
| Total Population Age 25+ |
4,706 |
35,963 |
257,437 |
| Grade K - 9 |
8.2% |
5.8% |
4.7% |
| Grade 9 - 12 |
17.1% |
14.4% |
11.5% |
| High School Graduate |
38.9% |
33.0% |
26.4% |
| Associates Degree |
5.2% |
6.8% |
8.0% |
| Bachelor's Degree |
8.6% |
10.7% |
15.3% |
| Graduate Degree |
4.7% |
9.6% |
13.7% |
| Some College, No Degree |
17.4% |
19.8% |
20.3% |
|
|
Household Income
|
5 Miles |
15 Miles |
25 Miles |
| Income $ 0 - $9,999 |
16.3% |
11.8% |
15.3% |
| Income $ 10,000 - $14,999 |
8.1% |
5.7% |
7.1% |
| Income $ 15,000 - $24,999 |
12.9% |
13.6% |
13.2% |
| Income $ 25,000 - $34,999 |
16.2% |
14.2% |
13.6% |
| Income $ 35,000 - $49,999 |
14.1% |
14.5% |
14.3% |
| Income $ 50,000 - $74,999 |
14.9% |
17.1% |
16.1% |
| Income $ 75,000 - $99,999 |
8.4% |
9.5% |
8.9% |
| Income $100,000 - $124,999 |
3.8% |
5.4% |
4.7% |
| Income $125,000 - $149,999 |
2.6% |
3.2% |
2.6% |
| Income $150,000 + |
2.6% |
5.0% |
4.0% |
| Average Household Income |
$44,481 |
$52,693 |
$48,761 |
| Median Household Income |
$32,811 |
$38,354 |
$35,510 |
| Per Capita Income |
$17,814 |
$21,690 |
$21,165 |
|
|
Vehicles Available
|
5 Miles |
15 Miles |
25 Miles |
| 0 Vehicles Available |
6.3% |
4.4% |
6.7% |
| 1 Vehicle Available |
38.8% |
35.6% |
43.2% |
| 2+ Vehicles Available |
55.0% |
60.0% |
50.1% |
| Average Vehicles Per Household |
1.80 |
2.00 |
1.80 |
| Total Vehicles Available |
4,854 |
37,105 |
262,803 |
|
|
2000 Census Demographics
|
5 Miles |
15 Miles |
25 Miles |
| Total Population |
6,533 |
42,217 |
331,321 |
| Total Households |
2,494 |
16,412 |
133,416 |
| Female Population |
3,443 |
21,700 |
169,994 |
| % Female |
52.7% |
51.4% |
51.3% |
| Male Population |
3,090 |
20,517 |
161,327 |
| % Male |
47.3% |
48.6% |
48.7% |
|
|
Age
|
5 Miles |
15 Miles |
25 Miles |
| Age 0 - 4 |
6.5% |
5.9% |
5.2% |
| Age 5 - 14 |
14.3% |
14.1% |
11.6% |
| Age 15 - 19 |
7.5% |
6.8% |
8.9% |
| Age 20 - 24 |
5.5% |
4.5% |
12.6% |
| Age 25 - 34 |
11.0% |
11.3% |
13.3% |
| Age 35 - 44 |
14.8% |
15.9% |
13.4% |
| Age 45 - 54 |
13.0% |
15.8% |
12.0% |
| Age 55 - 64 |
10.6% |
11.3% |
8.6% |
| Age 65 - 74 |
8.6% |
8.2% |
7.6% |
| Age 75 - 84 |
6.1% |
4.8% |
5.3% |
| Age 85 + |
2.1% |
1.3% |
1.6% |
| Median Age |
38.7 |
39.8 |
33.8 |
|
|
Housing Units Trend
|
5 Miles |
15 Miles |
25 Miles |
| Total Housing Units |
2,761 |
18,295 |
147,201 |
| Owner Occupied Housing Units |
70.3% |
75.3% |
56.2% |
| Renter Occupied Housing Units |
20.1% |
14.4% |
34.4% |
| Vacant Housing Units |
9.7% |
10.3% |
9.4% |
|
|
Race and Ethnicity
|
5 Miles |
15 Miles |
25 Miles |
| American Indian, Eskimo, Aleut |
0.5% |
0.4% |
0.3% |
| Asian, and Hawaiian or other Pacific Islander |
0.5% |
0.7% |
2.6% |
| Black |
28.1% |
16.4% |
18.3% |
| White |
68.5% |
79.9% |
75.4% |
| Other |
1.0% |
1.2% |
1.5% |
| Two or More Races |
1.4% |
1.4% |
1.8% |
| Hispanic Ethnicity |
4.1% |
5.0% |
5.8% |
| Not of Hispanic Ethnicity |
95.9% |
95.0% |
94.3% |
|
|
Marital Status
|
5 Miles |
15 Miles |
25 Miles |
| Age 15 + Population |
5,176 |
33,738 |
275,657 |
| Divorced |
11.1% |
11.4% |
10.4% |
| Never Married |
24.7% |
21.6% |
34.6% |
| Now Married |
48.0% |
56.2% |
43.4% |
| Separated |
6.4% |
3.8% |
5.3% |
| Widowed |
9.8% |
7.1% |
6.3% |
|
|
Educational Attainment
|
5 Miles |
15 Miles |
25 Miles |
| Total Population Age 25+ |
4,325 |
28,965 |
204,745 |
| Grade K - 9 |
5.2% |
4.8% |
3.9% |
| Grade 9 - 11, No diploma |
17.2% |
14.4% |
11.8% |
| High School Graduate |
39.0% |
33.2% |
27.1% |
| Associates Degree |
5.4% |
6.8% |
8.0% |
| Bachelor's Degree |
8.5% |
10.7% |
14.9% |
| Graduate Degree |
4.6% |
9.7% |
13.2% |
| Some College, No Degree |
17.2% |
19.5% |
20.3% |
| No Schooling Completed |
2.8% |
0.9% |
0.9% |
| Public School Enrollment |
92.9% |
87.7% |
90.7% |
| Private School Enrollment |
7.1% |
12.3% |
9.3% |
|
|
Household Income
|
5 Miles |
15 Miles |
25 Miles |
| Income $ 0 - $9,999 |
17.5% |
12.4% |
16.3% |
| Income $ 10,000 - $14,999 |
9.6% |
6.6% |
8.3% |
| Income $ 15,000 - $24,999 |
16.4% |
17.1% |
16.6% |
| Income $ 25,000 - $34,999 |
17.7% |
15.3% |
14.8% |
| Income $ 35,000 - $49,999 |
13.6% |
16.0% |
15.2% |
| Income $ 50,000 - $74,999 |
14.8% |
16.0% |
15.0% |
| Income $ 75,000 - $99,999 |
4.7% |
7.3% |
6.4% |
| Income $100,000 - $124,999 |
3.3% |
3.9% |
3.2% |
| Income $125,000 - $149,999 |
0.6% |
1.7% |
1.6% |
| Income $150,000 - $199,999 |
0.9% |
1.6% |
1.2% |
| Income $200,000 or More |
0.9% |
2.1% |
1.6% |
| Average Household Income |
$41,046 |
$48,804 |
$42,864 |
| Median Household Income |
$28,286 |
$33,951 |
$30,762 |
| Per Capita Income |
$15,670 |
$18,973 |
$17,260 |
|
|
Vehicles Available
|
5 Miles |
15 Miles |
25 Miles |
| 0 Vehicles Available |
6.4% |
4.4% |
6.9% |
| 1 Vehicle Available |
40.0% |
35.6% |
42.9% |
| 2 Vehicles Available |
36.6% |
42.3% |
36.7% |
| 3+ Vehicles Available |
17.1% |
17.7% |
13.5% |
| Average Vehicles Per Household |
1.50 |
1.60 |
1.50 |
| Total Vehicles Available |
4,218 |
29,366 |
215,502 |
|
|
Occupations
|
5 Miles |
15 Miles |
25 Miles |
| Blue Collar Occupations |
1,256 |
7,623 |
51,782 |
| White Collar Occupations |
1,330 |
10,711 |
94,148 |
| % Blue Collar Workers |
48.6% |
41.6% |
35.5% |
| % White Collar Workers |
51.4% |
58.4% |
64.5% |
|
|
1990 Demographics
|
5 Miles |
15 Miles |
25 Miles |
| Total Population |
5,603 |
31,617 |
269,823 |
| Total Households |
2,012 |
11,930 |
105,824 |
| Female Population |
3,068 |
16,367 |
138,160 |
| % Female |
54.8% |
51.8% |
51.2% |
| Male Population |
2,535 |
15,249 |
131,663 |
| % Male |
45.3% |
48.2% |
48.8% |
|
|
Age
|
5 Miles |
15 Miles |
25 Miles |
| Total Population |
5,603 |
31,617 |
269,823 |
| Age 0 - 4 |
7.6% |
7.2% |
6.5% |
| Age 5 - 14 |
14.8% |
14.4% |
12.0% |
| Age 15 - 19 |
7.8% |
6.4% |
8.4% |
| Age 20 - 24 |
5.6% |
5.3% |
12.6% |
| Age 25 - 34 |
14.3% |
15.1% |
16.9% |
| Age 35 - 44 |
13.0% |
15.6% |
13.5% |
| Age 45 - 54 |
9.8% |
10.9% |
8.6% |
| Age 55 - 64 |
9.3% |
10.0% |
8.0% |
| Age 65 - 74 |
9.8% |
9.6% |
8.4% |
| Age 75 - 84 |
6.0% |
4.4% |
4.1% |
| Age 85 + |
2.1% |
1.1% |
1.1% |
| Median Age |
35.0 |
36.0 |
31.1 |
|
|
Housing Units
|
5 Miles |
15 Miles |
25 Miles |
| Total Housing Units |
2,362 |
14,179 |
119,651 |
| Owner Occupied Housing Units |
65.2% |
68.7% |
52.7% |
| Renter Occupied Housing Units |
19.9% |
15.5% |
35.8% |
| Vacant Housing Units |
14.8% |
15.9% |
11.6% |
|
| Race and Ethnicity |
5 Miles |
15 Miles |
25 Miles |
| American Indian, Eskimo, Aleut |
0.3% |
0.3% |
0.3% |
| Asian |
0.9% |
0.5% |
1.9% |
| Black |
28.9% |
19.8% |
19.2% |
| White |
69.2% |
78.8% |
78.0% |
| Other |
0.6% |
0.6% |
0.8% |
| Hispanic Ethnicity |
2.0% |
2.5% |
3.4% |
| Not of Hispanic Ethnicity |
98.0% |
97.5% |
96.7% |
|
| Educational Attainment |
5 Miles |
15 Miles |
25 Miles |
| Total Population Age 25+ |
3,604 |
21,108 |
163,323 |
| Grade K - 9 |
20.0% |
12.0% |
7.9% |
| Grade 9 - 12 |
21.6% |
18.8% |
15.2% |
| High School Graduate |
29.6% |
30.4% |
26.6% |
| Associates Degree |
4.8% |
7.0% |
7.7% |
| Bachelor's Degree |
6.9% |
9.6% |
13.4% |
| Graduate Degree |
2.6% |
7.2% |
12.0% |
| Some College, No Degree |
14.6% |
15.0% |
17.2% |
|
| Household Income |
5 Miles |
15 Miles |
25 Miles |
| Income $ 0 - $9,999 |
26.3% |
20.8% |
23.3% |
| Income $ 10,000 - $19,999 |
24.9% |
23.4% |
23.1% |
| Income $ 20,000 - $29,999 |
19.4% |
18.6% |
18.0% |
| Income $ 30,000 - $39,999 |
11.4% |
13.1% |
12.5% |
| Income $ 40,000 - $49,999 |
6.8% |
8.8% |
8.0% |
| Income $ 50,000 - $59,999 |
3.8% |
4.6% |
5.3% |
| Income $ 60,000 - $74,999 |
3.3% |
4.8% |
4.3% |
| Income $ 75,000 - $99,999 |
2.1% |
2.3% |
2.8% |
| Income $100,000 - $124,999 |
1.2% |
1.4% |
1.2% |
| Income $125,000 - $149,999 |
0.9% |
0.5% |
0.6% |
| Income $150,000 + |
0.1% |
1.7% |
1.0% |
| Average Household Income |
$25,275 |
$31,296 |
$29,709 |
| Median Household Income |
$19,228 |
$22,689 |
$21,589 |
| Per Capita Income |
$9,247 |
$11,961 |
$11,889 |
|
| Vehicles Available |
5 Miles |
15 Miles |
25 Miles |
| 0 Vehicles Available |
9.4% |
6.5% |
8.1% |
| 1 Vehicle Available |
38.8% |
34.4% |
37.6% |
| 2+ Vehicles Available |
51.8% |
59.1% |
54.2% |
| Average Vehicles Per Household |
1.60 |
1.70 |
1.60 |
| Total Vehicles Available |
3,211 |
20,658 |
168,856 |
|
|
Trends
|
|
|
|
| Population Trend |
5 Miles |
15 Miles |
25 Miles |
| 1990 |
5,603 |
31,617 |
269,823 |
| 2000 |
6,533 |
42,217 |
331,321 |
| Change 1990 to 2000 |
16.6% |
33.5% |
22.8% |
| 2004 |
6,746 |
46,040 |
349,551 |
| 2009 |
7,102 |
50,556 |
372,055 |
| Change 2004 to 2009 |
5.3% |
9.8% |
6.4% |
|
| Household Trend |
5 Miles |
15 Miles |
25 Miles |
| 1990 |
2,012 |
11,930 |
105,824 |
| 2000 |
2,494 |
16,412 |
133,416 |
| Change 1990 to 2000 |
24.0% |
37.6% |
26.1% |
| 2004 |
2,629 |
18,350 |
144,439 |
| 2009 |
2,827 |
20,622 |
157,753 |
| Change 2004 to 2009 |
7.5% |
12.4% |
9.2% |
|
| Average Household Size Trend |
5 Miles |
15 Miles |
25 Miles |
| 1990 |
2.67 |
2.62 |
2.41 |
| 2000 |
2.56 |
2.55 |
2.34 |
| 2004 |
2.51 |
2.49 |
2.29 |
| 2009 |
2.46 |
2.43 |
2.24 |
|
| Median Age Trend |
5 Miles |
15 Miles |
25 Miles |
| 1990 |
35 |
36 |
31 |
| 2000 |
39 |
40 |
34 |
| Change 1990 to 2000 |
10.6% |
10.7% |
8.8% |
| 2004 |
39 |
40 |
34 |
| 2009 |
40 |
40 |
36 |
| Change 2004 to 2009 |
1.4% |
0.0% |
3.6% |
|
| Housing Units Trend |
5 Miles |
15 Miles |
25 Miles |
| Total Housing Units |
|
|
|
| Change 1990 to 2000 |
16.9% |
29.0% |
23.0% |
| Change 2004 to 2009 |
7.7% |
12.5% |
9.4% |
| Owner Occupied Housing Units |
|
|
|
| Change 1990 to 2000 |
25.9% |
41.4% |
31.2% |
| Change 2004 to 2009 |
9.4% |
13.6% |
12.1% |
| Renter Occupied Housing Units |
|
|
|
| Change 1990 to 2000 |
17.5% |
20.4% |
18.5% |
| Change 2004 to 2009 |
0.7% |
5.8% |
4.2% |
| Vacant Housing Units |
|
|
|
| Change 1990 to 2000 |
-23.8% |
-16.3% |
-0.3% |
| Change 2004 to 2009 |
8.7% |
13.8% |
11.1% |
|
| Race and Ethnicity Trend |
5 Miles |
15 Miles |
25 Miles |
| American Indian, Eskimo, Aleut |
|
|
|
| Change 1990 to 2000 |
91.7% |
94.2% |
59.7% |
| Change 2004 to 2009 |
1.2% |
10.1% |
7.3% |
| Asian or Pacific Islander |
|
|
|
| Change 1990 to 2000 |
-36.8% |
83.4% |
72.9% |
| Change 2004 to 2009 |
1.0% |
12.2% |
4.8% |
| Black |
|
|
|
| Change 1990 to 2000 |
13.1% |
10.2% |
17.3% |
| Change 2004 to 2009 |
5.5% |
11.4% |
6.5% |
| White |
|
|
|
| Change 1990 to 2000 |
15.4% |
35.5% |
18.8% |
| Change 2004 to 2009 |
5.3% |
9.5% |
6.5% |
| Other |
|
|
|
| Change 1990 to 2000 |
95.5% |
156.7% |
142.4% |
| Change 2004 to 2009 |
4.0% |
9.5% |
5.1% |
| Hispanic Ethnicity |
|
|
|
| Change 1990 to 2000 |
141.5% |
169.6% |
110.8% |
| Change 2004 to 2009 |
19.7% |
23.3% |
11.6% |
| Not of Hispanic Ethnicity |
|
|
|
| Change 1990 to 2000 |
14.1% |
30.1% |
19.7% |
| Change 2004 to 2009 |
4.6% |
9.0% |
6.1% |
|

|
2000 US Census Employment Comparison Report
|
|
Occupation & Employment
|
5 Miles |
15 Miles |
25 Miles |
| Not in Labor Force |
2,326 |
13,764 |
114,573 |
| In Labor Force |
2,749 |
19,332 |
157,113 |
| Employed |
94.0% |
94.8% |
92.9% |
| Unemployed |
5.7% |
5.0% |
7.0% |
| In Armed Forces |
0.3% |
0.2% |
0.1% |
|
|
Employment by Industry
|
5 Miles |
15 Miles |
25 Miles |
| Accommodation and food services |
6.7% |
5.1% |
8.2% |
| Administrative, support & waste management service |
2.0% |
3.4% |
3.1% |
| Agriculture forestry fishing and hunting |
7.7% |
6.0% |
2.3% |
| Arts entertainment and recreation |
1.3% |
1.3% |
1.8% |
| Construction |
8.4% |
9.2% |
6.3% |
| Educational services |
11.3% |
13.8% |
17.1% |
| Finance and insurance |
4.0% |
3.3% |
3.4% |
| Health care and social assistance |
17.7% |
15.8% |
14.7% |
| Information |
0.3% |
1.5% |
2.6% |
| Management of companies and enterprises |
0.0% |
0.0% |
0.0% |
| Manufacturing |
6.6% |
7.0% |
5.8% |
| Mining |
0.0% |
0.0% |
0.0% |
| Other services (except public administration) |
6.2% |
4.2% |
4.8% |
| Professional scientific and technical services |
3.1% |
4.0% |
4.7% |
| Public administration |
5.7% |
5.9% |
5.3% |
| Real estate and rental and leasing |
1.1% |
2.0% |
2.0% |
| Retail trade |
9.5% |
10.3% |
12.3% |
| Transportation and warehousing |
3.3% |
3.1% |
2.4% |
| Utilities |
1.2% |
1.1% |
1.0% |
| Wholesale trade |
3.6% |
3.0% |
2.1% |
|
|
Means of Transportation to Work
|
5 Miles |
15 Miles |
25 Miles |
| Workers Age 16+ |
2,593 |
18,364 |
146,146 |
| Bicycle |
0.0% |
0.3% |
2.2% |
| Bus or trolley bus |
0.0% |
0.1% |
1.8% |
| Carpooled |
20.7% |
15.8% |
13.1% |
| Drove alone |
71.8% |
76.6% |
75.9% |
| Ferryboat |
0.0% |
0.0% |
0.0% |
| Motorcycle |
0.0% |
0.2% |
0.3% |
| Other means |
0.8% |
0.8% |
0.6% |
| Railroad |
0.0% |
0.0% |
0.0% |
| Streetcar or trolley car |
0.0% |
0.0% |
0.0% |
| Subway or elevated |
0.0% |
0.0% |
0.0% |
| Taxicab |
0.0% |
0.0% |
0.0% |
| Walked |
4.0% |
1.9% |
2.9% |
| Worked at home |
2.7% |
4.2% |
3.2% |
|
|
Occupation
|
5 Miles |
15 Miles |
25 Miles |
| Aircraft and traffic control occupations |
0.0% |
0.0% |
0.0% |
| Architects surveyors cartographers and engineers |
0.6% |
0.9% |
1.1% |
| Arts design entertainment sports and media occupation |
0.8% |
1.0% |
2.2% |
| Building and grounds cleaning and maintenance occupat |
4.5% |
4.4% |
3.6% |
| Business operations specialists |
1.0% |
1.6% |
1.4% |
| Community and social services occupations |
1.6% |
1.7% |
2.0% |
| Computer and mathematical occupations |
0.8% |
1.3% |
1.8% |
| Construction trades workers |
6.3% |
6.4% |
4.3% |
| Drafters engineering and mapping technicians |
0.1% |
0.6% |
0.5% |
| Education training and library occupations |
4.2% |
6.5% |
8.6% |
| Extraction workers |
0.0% |
0.1% |
0.1% |
| Farmers and farm managers |
2.7% |
2.1% |
0.7% |
| Farming fishing and forestry occupations |
3.0% |
1.9% |
0.9% |
| Financial specialists |
3.1% |
1.7% |
1.6% |
| Fire fighting prevention and law enforcement workers |
2.3% |
1.9% |
1.5% |
| Food preparation and serving related occupations |
5.8% |
4.1% |
6.0% |
| Health diagnosing and treating practitioners and tech |
2.4% |
6.0% |
5.6% |
| Health technologists and technicians |
2.2% |
2.2% |
2.2% |
| Healthcare support occupations |
4.7% |
2.1% |
2.2% |
| Installation maintenance and repair occupations |
3.6% |
3.9% |
3.0% |
| Legal occupations |
0.9% |
0.9% |
0.9% |
| Life physical and social science occupations |
1.0% |
1.7% |
2.3% |
| Management occupations except farmers and farm manage |
5.1% |
6.8% |
7.3% |
| Material moving workers |
2.9% |
2.0% |
1.8% |
| Motor vehicle operators |
3.4% |
3.3% |
2.6% |
| Office and administrative support occupations |
15.5% |
13.7% |
14.8% |
| Personal care and service occupations |
4.1% |
3.6% |
3.4% |
| Production |
7.0% |
5.9% |
4.5% |
| Protective Service Occupations |
0.3% |
0.7% |
0.9% |
| Rail water and other transportation occupations |
0.3% |
0.1% |
0.1% |
| Sales and related occupations |
9.3% |
9.8% |
11.6% |
| Supervisors construction and extraction workers |
0.5% |
0.9% |
0.7% |
| Supervisors transportation and material moving worker |
0.0% |
0.3% |
0.1% |
|
| % in Blue Collar Occupations |
48.6% |
41.6% |
35.5% |
| % in White Collar Occupations |
51.4% |
58.4% |
64.5% |
|
|
Travel Time to Work
|
5 Miles |
15 Miles |
25 Miles |
| Median Travel Time To Work in Minutes |
28 |
27 |
19 |
| 0 to 5 |
6.2% |
2.9% |
2.8% |
| 5 to 9 |
15.7% |
6.6% |
11.3% |
| 10 to 14 |
9.3% |
6.7% |
17.3% |
| 15 to 19 |
7.8% |
11.6% |
20.7% |
| 20 to 24 |
7.9% |
16.7% |
16.0% |
| 25 to 29 |
4.0% |
7.2% |
5.2% |
| 30 to 34 |
19.2% |
20.2% |
11.1% |
| 35 to 39 |
4.1% |
3.1% |
1.5% |
| 40 to 44 |
4.2% |
4.3% |
1.9% |
| 45 to 59 |
11.1% |
10.2% |
4.5% |
| 60 to 89 |
2.8% |
3.3% |
2.4% |
| 90 or more |
5.0% |
3.0% |
2.1% |
| Worked at home |
2.7% |
4.2% |
3.2% |
|